Getting to know the User Interface

1. Main Menu

client

Shows the explorer panel that contains all gRPC clients.  Testing of all methods types such as Unary, Server Streaming, Client Streaming, and Duplex Streaming are supported

tests

Shows the functional test panel that contains all the functional tests defined for each gRPC client.  Every functional test allows for a visual comparison of expected and actual responses

colxn (collections)

Shows the collections of functional tests.  Each collection contains functional tests that can be executed in parallel or in sequence

perf tests

Shows the performance test panel that contains all the perf tests defined for each gRPC client.  Various types of load testing scenarios can be configured for each per test

mock

Shows the mock services panel.  gRPC services can be “mocked” by simply providing the protobuf file or address of a reflection service

2. gRPC client

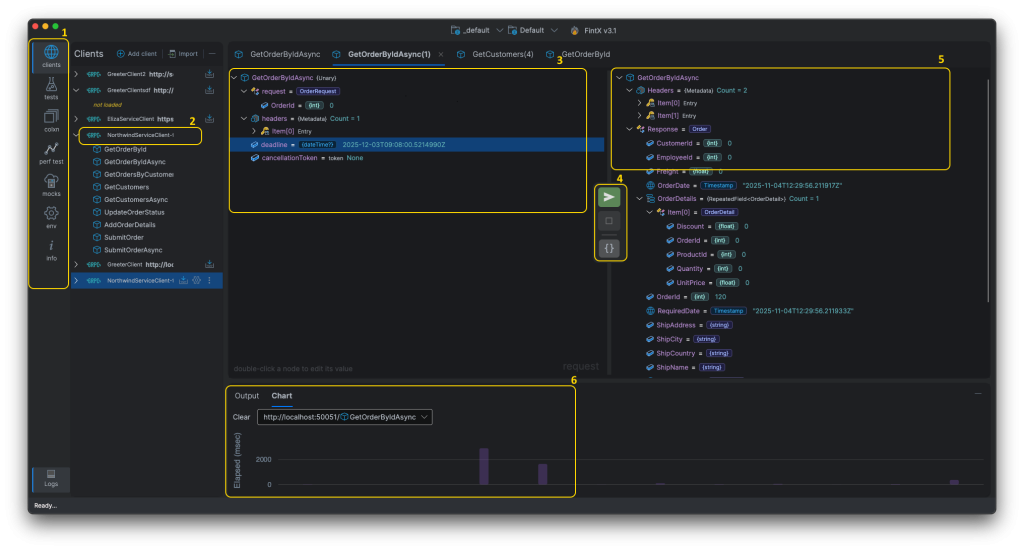
After clicking the Compile button, all the methods of the generated gRPC client will be displayed.  Double-click a method to open it in a new tab and start testing it 

3. Request Panel

Displays user-friend treeview editor that allows the user to configure the values that will be sent in the gRPC request.  For advanced users, the treeview can be displayed as json that can be directly edited

4. Actions

Contains the buttons to trigger actions

  • Send the request
  • Cancel the request and responses (for streaming methods)
  • Toggle between JSON and Treeview

5. Response Panel

Displays the response from the gRPC Service

6.Logs and Charts Panel

Shows the log entries and chart plotting the duration (in msec) of each call to the gRPC service

Leave a Reply

Your email address will not be published. Required fields are marked *